
OPQ’s State of Pharmaceutical Quality Report Is a Data Bonanza (with Cameos by Eye Drops and Hand Sanitizers)
June 17, 2024FDA’s Office of Pharmaceutical Quality (OPQ) in the Center for Drug Evaluation and Research (CDER) is charged with assuring that drugs marketed in the U.S. are safe, effective, and meet appropriate quality standards. While no office at FDA truly works in a vacuum, we can safely call OPQ the tip of FDA’s quality spear.
Last week, OPQ released its 6th Annual Report on the State of Pharmaceutical Quality. This report is not to be confused with OPQ’s Annual Report, a shorter and gauzier look into OPQ’s operations. Instead, the State of Pharmaceutical Quality Report provides more detailed statistics and data from FY2023 (October 1, 2022—September 30, 2023), and a clearer window into enforcement priorities.
The Quality Report includes a rundown of what the universe of FDA-registered drug manufacturing sites looks like as included in the CDER Site Catalog. Of the 4,819 facilities in the Site Catalog, 60% manufacture drugs approved under a New Drug Application (NDA), Abbreviated NDA (ANDA), or Biologics License Application (BLA). (See here and here to better understand what BLAs are under CDER’s purview, as opposed to the Center for Biologics Evaluation and Research (CBER)). The remaining 40% are “no application” sites that manufacture drugs not marketed under an application approved by FDA, which includes OTC monograph drugs, homeopathic products, and unapproved prescription drug products (e.g., drugs subject to an open drug efficacy study implementation (DESI) program proceeding).
Medical gas manufacturers and 503B outsourcing facilities—both of which meet the definition of “manufacturer”—are excluded from the Quality Report. However, sites that manufacture exclusively alcohol-based hand sanitizers are no longer excluded as they had been from the FY2020, FY2021, and FY2022 reports.
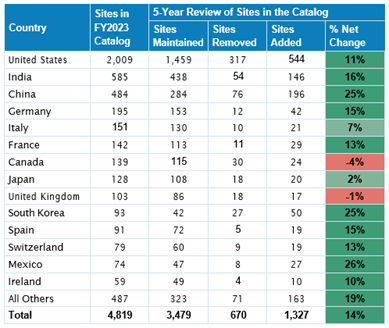
From FY2019 through FY2023, Mexico (26%), China, (25%), South Korea (25%), India (16%), Germany (15%), and Spain (15%) saw the most substantial increase in registered facilities by percentage. Canada (-4%) and the U.K. (-1%) were the only countries that experienced a net decrease over OPQ’s 5-year survey. Measured in raw numbers, the U.S. is still the registered facilities leader with 2,009 of the overall 4,819 registered facilities. India (585), China (484), Germany (195), and Italy (151) follow.
![]()
See here: Source: OPQ Report on State of Pharmaceutical Quality, Table 1, page 3
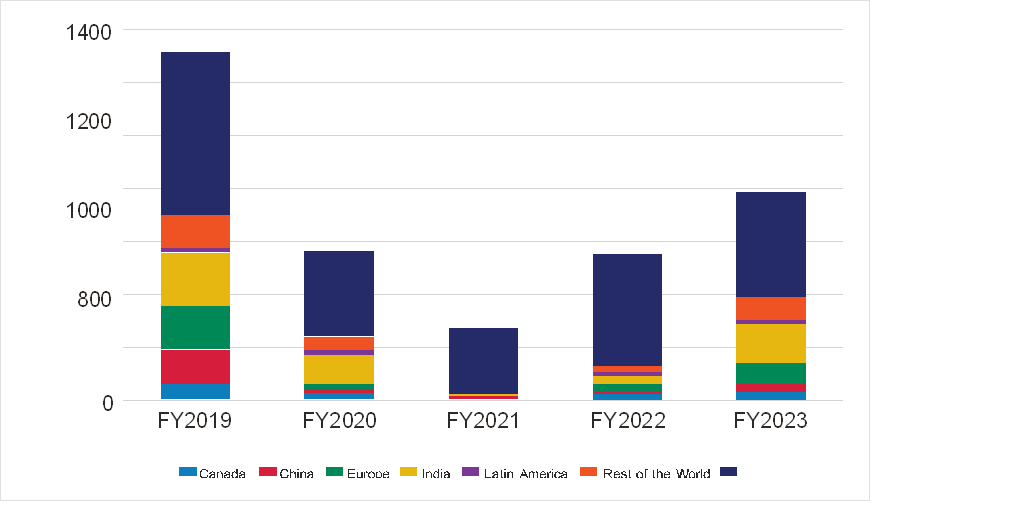
Readers of this blog know that as the pharmaceutical industry continues its global growth, FDA has wrangled with inspecting foreign sites to varying degrees of success. Foreign drug quality inspections are conducted either by FDA or by a foreign regulatory authority with which FDA has a Mutual Recognition Agreement (MRA)—which currently includes all EU nations, Switzerland, and the United Kingdom. The number of MRA inspections increased from 144 in FY2022 to 187 in FY2023 (the highest number of MRA inspections to date). Inspections continued their post-pandemic creep upwards in FY2023, at just under 800 inspections of registered facilities internationally. That’s still way down from the over 1,300 inspections in FY2019, but way up from the pandemic low of under 300 inspections in FY2021. The bulk of inspections are still taking place in the U.S., but OPQ reports a substantial increase in India in FY2023, driven by for-cause inspections triggered by some dubious and notable quality deficiencies. OPQ professes a desire to bolster inspection numbers in China but says travel restrictions have hampered that effort.
![]()
See here: Source: OPQ Report on State of Pharmaceutical Quality, Figure 1, page 4
A note here that while the sheer number of inspections is a useful metric, the post-inspection classification of facilities also tells an important part of the story. OPQ reports that globally, “94% of all sites in the CDER Site Catalog received no action indicated (NAI) or voluntary action indicated (VAI) as their most recent inspection classification.” Perhaps predictably given the for-cause nature of inspections there, India lagged with 89% of inspected sites achieving good levels of classification status, European sites set the gold standard in FY2023 at 98% either NAI or VAI.
Other notes from the report include:
- FDA keeps a vast catalog of drug products. At the end of FY2023, the FDA Drug Product Catalog included 17,519 application products, to include 13,572 ANDAs, 3,593 NDAs, 354 BLAs, and 131,367 non-application products such as over-the-counter drugs. That total—148,886 listed products—is a 6% increase over FY2022. Every category saw an increase last year, led by BLAs (9%).
- FDA continues to increase its use of import alerts as an enforcement tool, adding 93 companies to import alerts in FY2023. In FY2021 and FY2022 combined, FDA added 77 companies. Of the sites placed on quality-related import alert, 90% are manufacturers of OTC monograph drugs and a full third of sites added (31) were manufacturers of hand sanitizers.
- Recalls declined in FY2023, down to 674 from 912 in FY2022. Most of those recalls were from antibacterials, cardiovascular agents, and the well-publicized spate of adulterated ophthalmic agents which accounted for 17% of all recalled products. The 53.7% increase in quality-related consumer complaints in FY2023 was also largely attributed to the recall of OTC eye drops.
- FDA issued 94 Warning Letters in FY2023, approaching its previous high from FY2019. Of the 94 quality-related Warning Letters, 80% were issued to manufacturers of OTC drugs—over half of which manufactured either hand sanitizer or products that could be contaminated with diethylene glycol (DEG) or ethylene glycol (EG).
- OPQ reports that the vast majority of the 81 drug shortages reported in CY2022-23 were due to quality issues (40%) and increase in demand (40%)—a significant change from 2013-2017 when quality issues were the cause of 62% of shortages.
The Quality Report comes out this year as FDA’s budget battle continues on Capitol Hill, and it makes a strong case that the Agency’s needs in this area dwarf its robust accomplishments. Every American consumer expects the U.S. to maintain its gold standard of pharmaceutical quality. While other tools are helpful to FDA, the data here show that in-person inspections are the primary tool to ensure global quality.